

Stick with Gold
Best in class miners are ready to rally again.

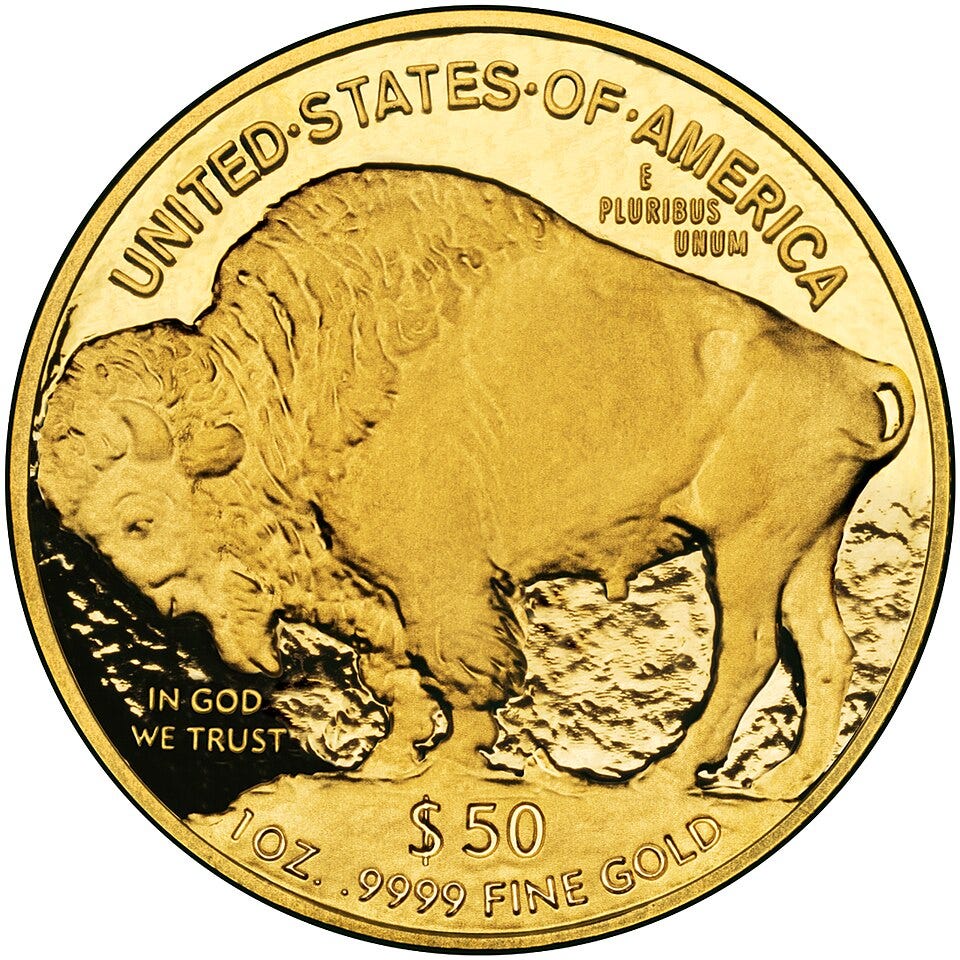
2006 American Buffalo Proof Reserve.
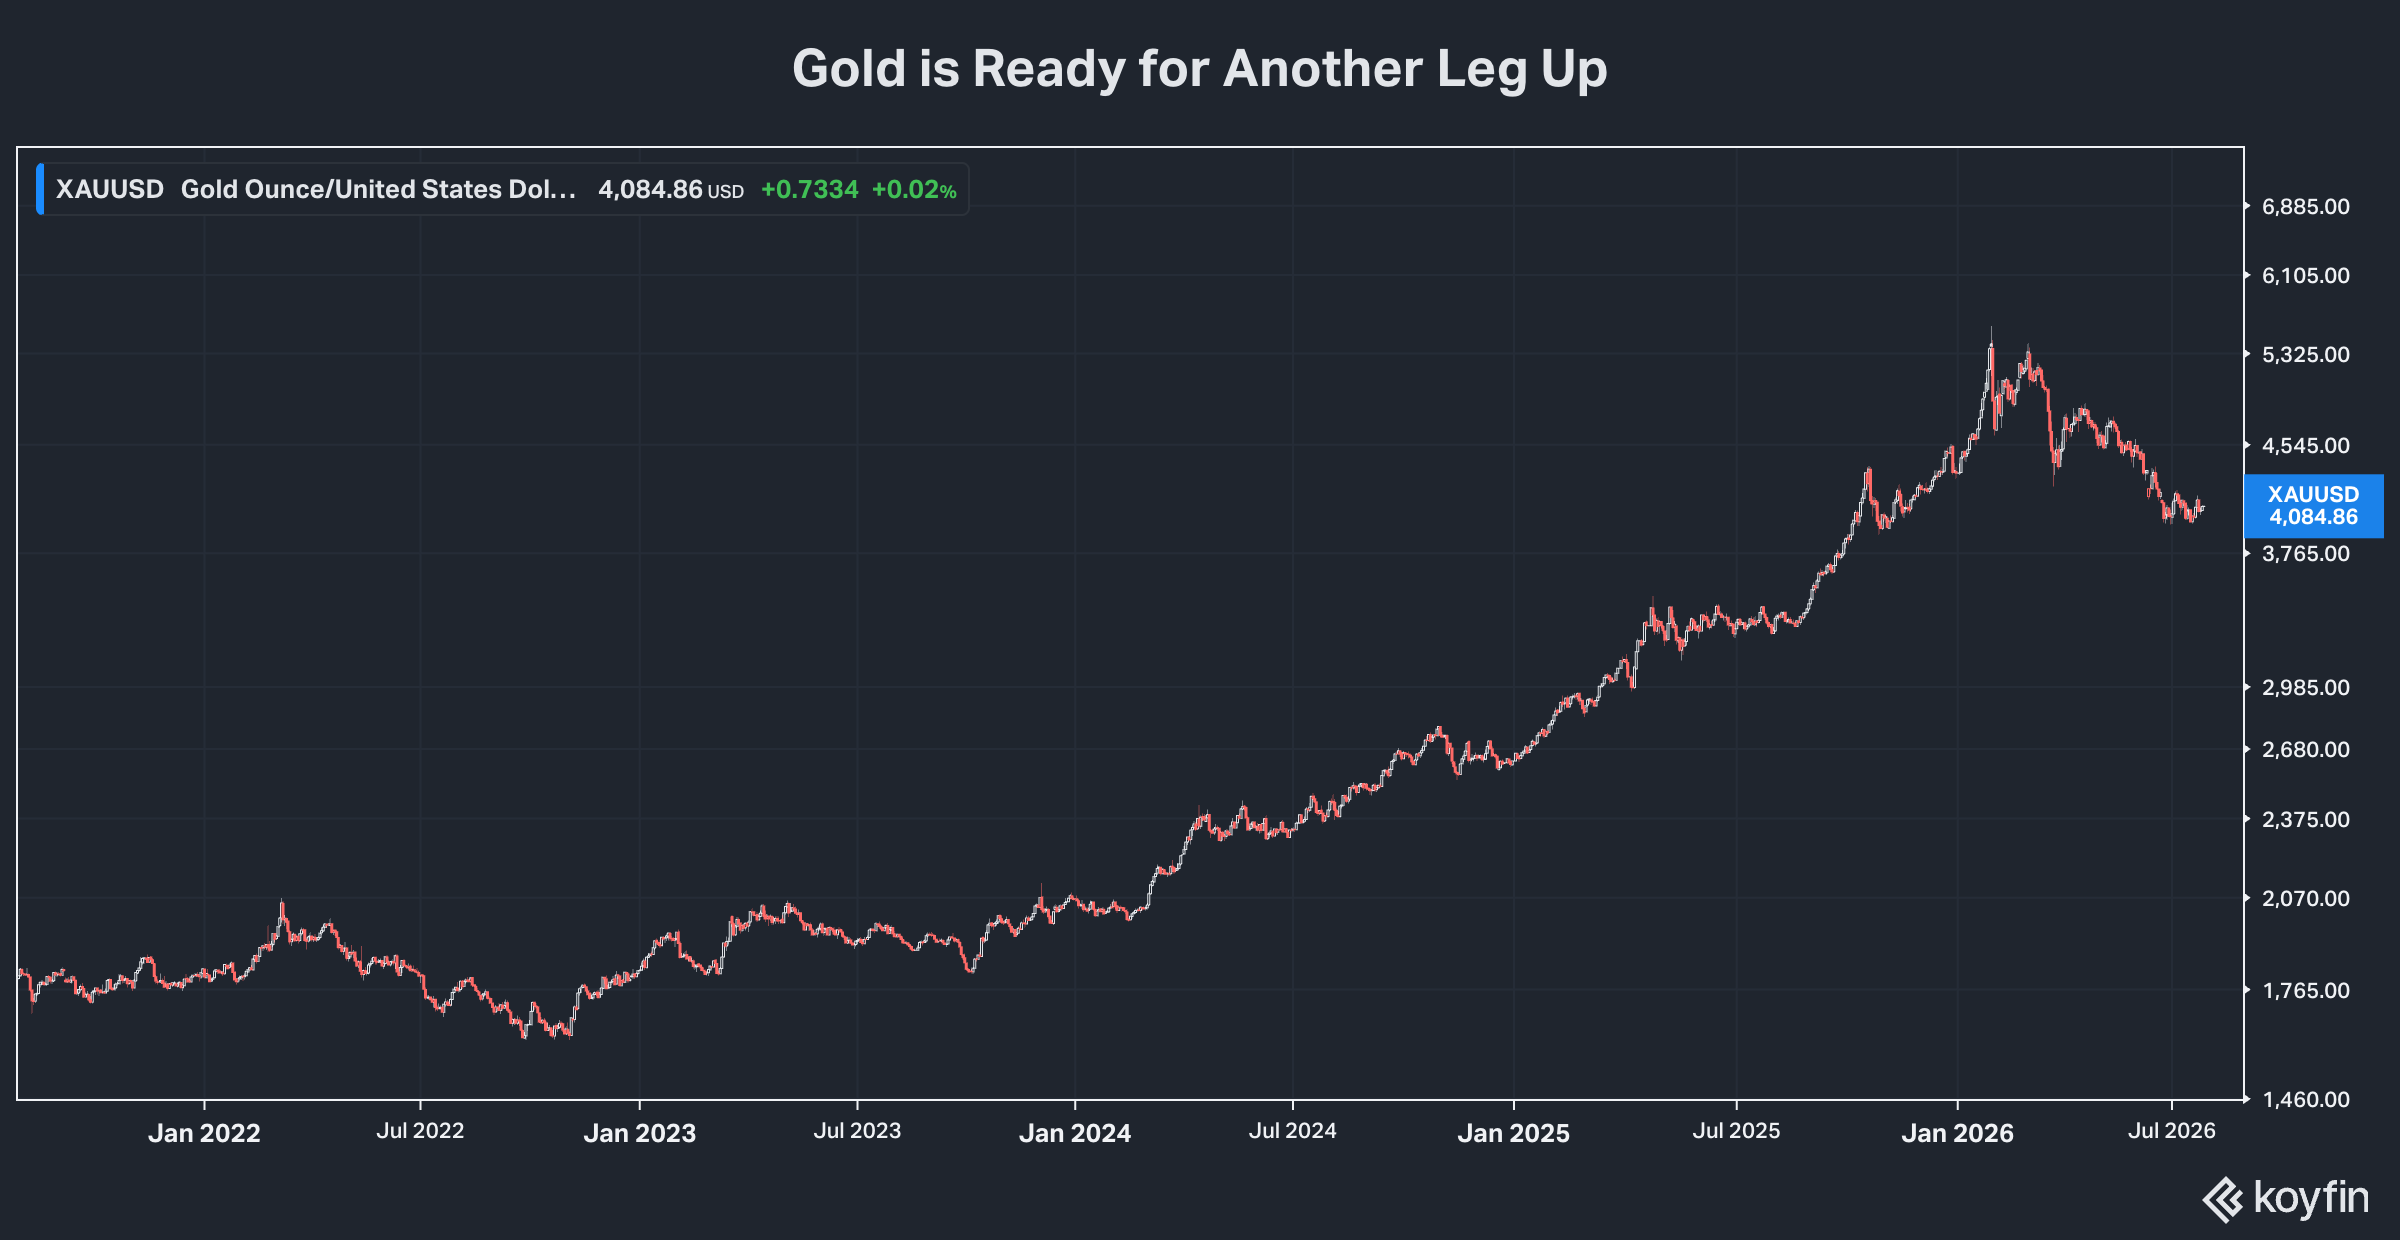
Editor’s note: At $4,050 and change, an ounce of gold is cheaper now than it was on January 1. It’s time to buy top quality gold stocks for another leg up in second half 2026.
I highlight the best picks in this post. The portfolio’s average year-to-date total return is 21.33%, with a yield of 4.5%.
Got a question or comment? Challenge me on the Discord and Substack webchat forums I host 24-7. Hope everyone is having a great summer!—RC
Gold soared to $5,600 an ounce in late January 2026, taking major mining stocks up with it. But since then, not much has gone right for gold investors.
Investor sentiment is cooling. And there’s growing consensus that recently surging inflation will be “transitory.”
That argument rests largely on the idea that employment is healthy in the US—and that the Federal Reserve will be able to cut off inflation by raising interest rates. As of Friday’s close, Fed Funds futures are pricing in an 80% chance of a rate hike by September.
New Chairman Kevin Warsh has promised more secretive central bank policymaking, meaning changes will no longer be telegraphed in advance. But the Fed has already set a fairly clear expectation that it intends to keep the interest rates it controls “higher for longer,” by stripping out the “easing” bias from its most recent formal policy statement.
That stands to reason. What’s up to now been the Fed’s preferred gauge of inflation—the Personal Consumption Expenditures Price Index—has been on the rise this year. The June year-over-year rate of 3.4% (excluding food and energy) is well above the central bank’s 2% target. And it’s running 40 basis points ahead of where it was at the beginning of the year.
More ominous, since early 2025, “acyclical” factors like healthcare costs have driven increases in the “core” rate, even as “cyclical” factors have tapered off. That throws cold water on the idea that a big and increasingly unlikely drop in energy prices will quell inflation, without the Fed having to do anything.
But how strong really is the US employment market—and by extension, how much flexibility does the US central bank really have to fight inflation?
Certainly, the official unemployment rate is very low at just 4.2%, according to the Bureau of Labor Statistics. And the U.S. Department of Labor reports unemployment insurance claims are at a 50-year low.
BLS, however, also reported net non-farm job creation of just 57,000 in June. Those figures are based on survey data rather than a hard count. And they’re frequently revised wildly from month to month. But lately, the trend has been to cut them, with both May and April reporting meaningful reductions.
Average hourly earnings for nonfarm workers are also frequently revised. But here too, the indication is of fairly tepid conditions for employment. The 12-month rate of increase, for example, is just 3.5%, barely keeping pace with the “core” rate of PCE inflation and well behind increases in food and energy prices.
That seems to indicate workers generally lack leverage when it comes to wages—a stark contrast with previous periods of strong employment conditions. So is the so-called “labor participation” rate of 61.5% recorded in June. That’s down 30 basis points from May. And it’s the lowest recorded rate since June 1976. And to the extent that’s accurate, it means a lot of Americans of working age are on the sidelines.
Again, most data like this are based on surveys that are frequently revised, sometimes dramatically. And this is a time of hyper-partisan politics as well as deep budget cuts to government agencies charged with collecting information headline numbers are based on. So, I think it’s healthy to view BLS numbers with a little skepticism, particularly when it comes to using them to make investment decisions.
Employment: An Anecdote
I also think it’s worthwhile to consider the trend for recent college graduates. According to BLS, unemployment among college degree holders aged 24 and younger was 8.9% in June. That compares to just 2.7% for all Americans with college degrees.
If you’re personally acquainted with the Class of 2026, you may think that’s an undercount. And I would agree.
A couple months ago, I toasted a group of Wesleyan University graduates in Middletown, CT. I told them they’d already proven they were a “resilient” generation. They’d stayed on track with their studies despite severe Covid disruption. And they’d won admission to and just graduated from an elite college, despite a record number of freshman class spaces taken up by students deferring entry from the previous year.
But I also warned them they were going to have to keep being resilient as they entered the labor force. Not only are they still competing for jobs with the young people who sat out the Covid year. But this is a time when businesses across industries are looking for ways to replace humans with AI. And post-DOGE, it may be a while before a career in government service looks attractive.
I’m happy to say the graduates I know best are pushing ahead. And even at 50% unemployment, there’s one person in two with a job. But there’s a reason why only 33% of Americans believe Trump Administration economic policies are on the right track, despite such a low official unemployment rate.
All of this to say that the Federal Reserve knows a lot more about actual employment conditions than we do from publicly released BLS statistics. And to the extent they’re weaker than the politicians and big media would have us believe, it’s likely they’ll fight inflation a lot more slowly than many investors seem to expect.
That may in fact be what the bond market is telling us. The 10-year Treasury note yield moved up close to 4.7% last week. That’s the highest level since early 2025.
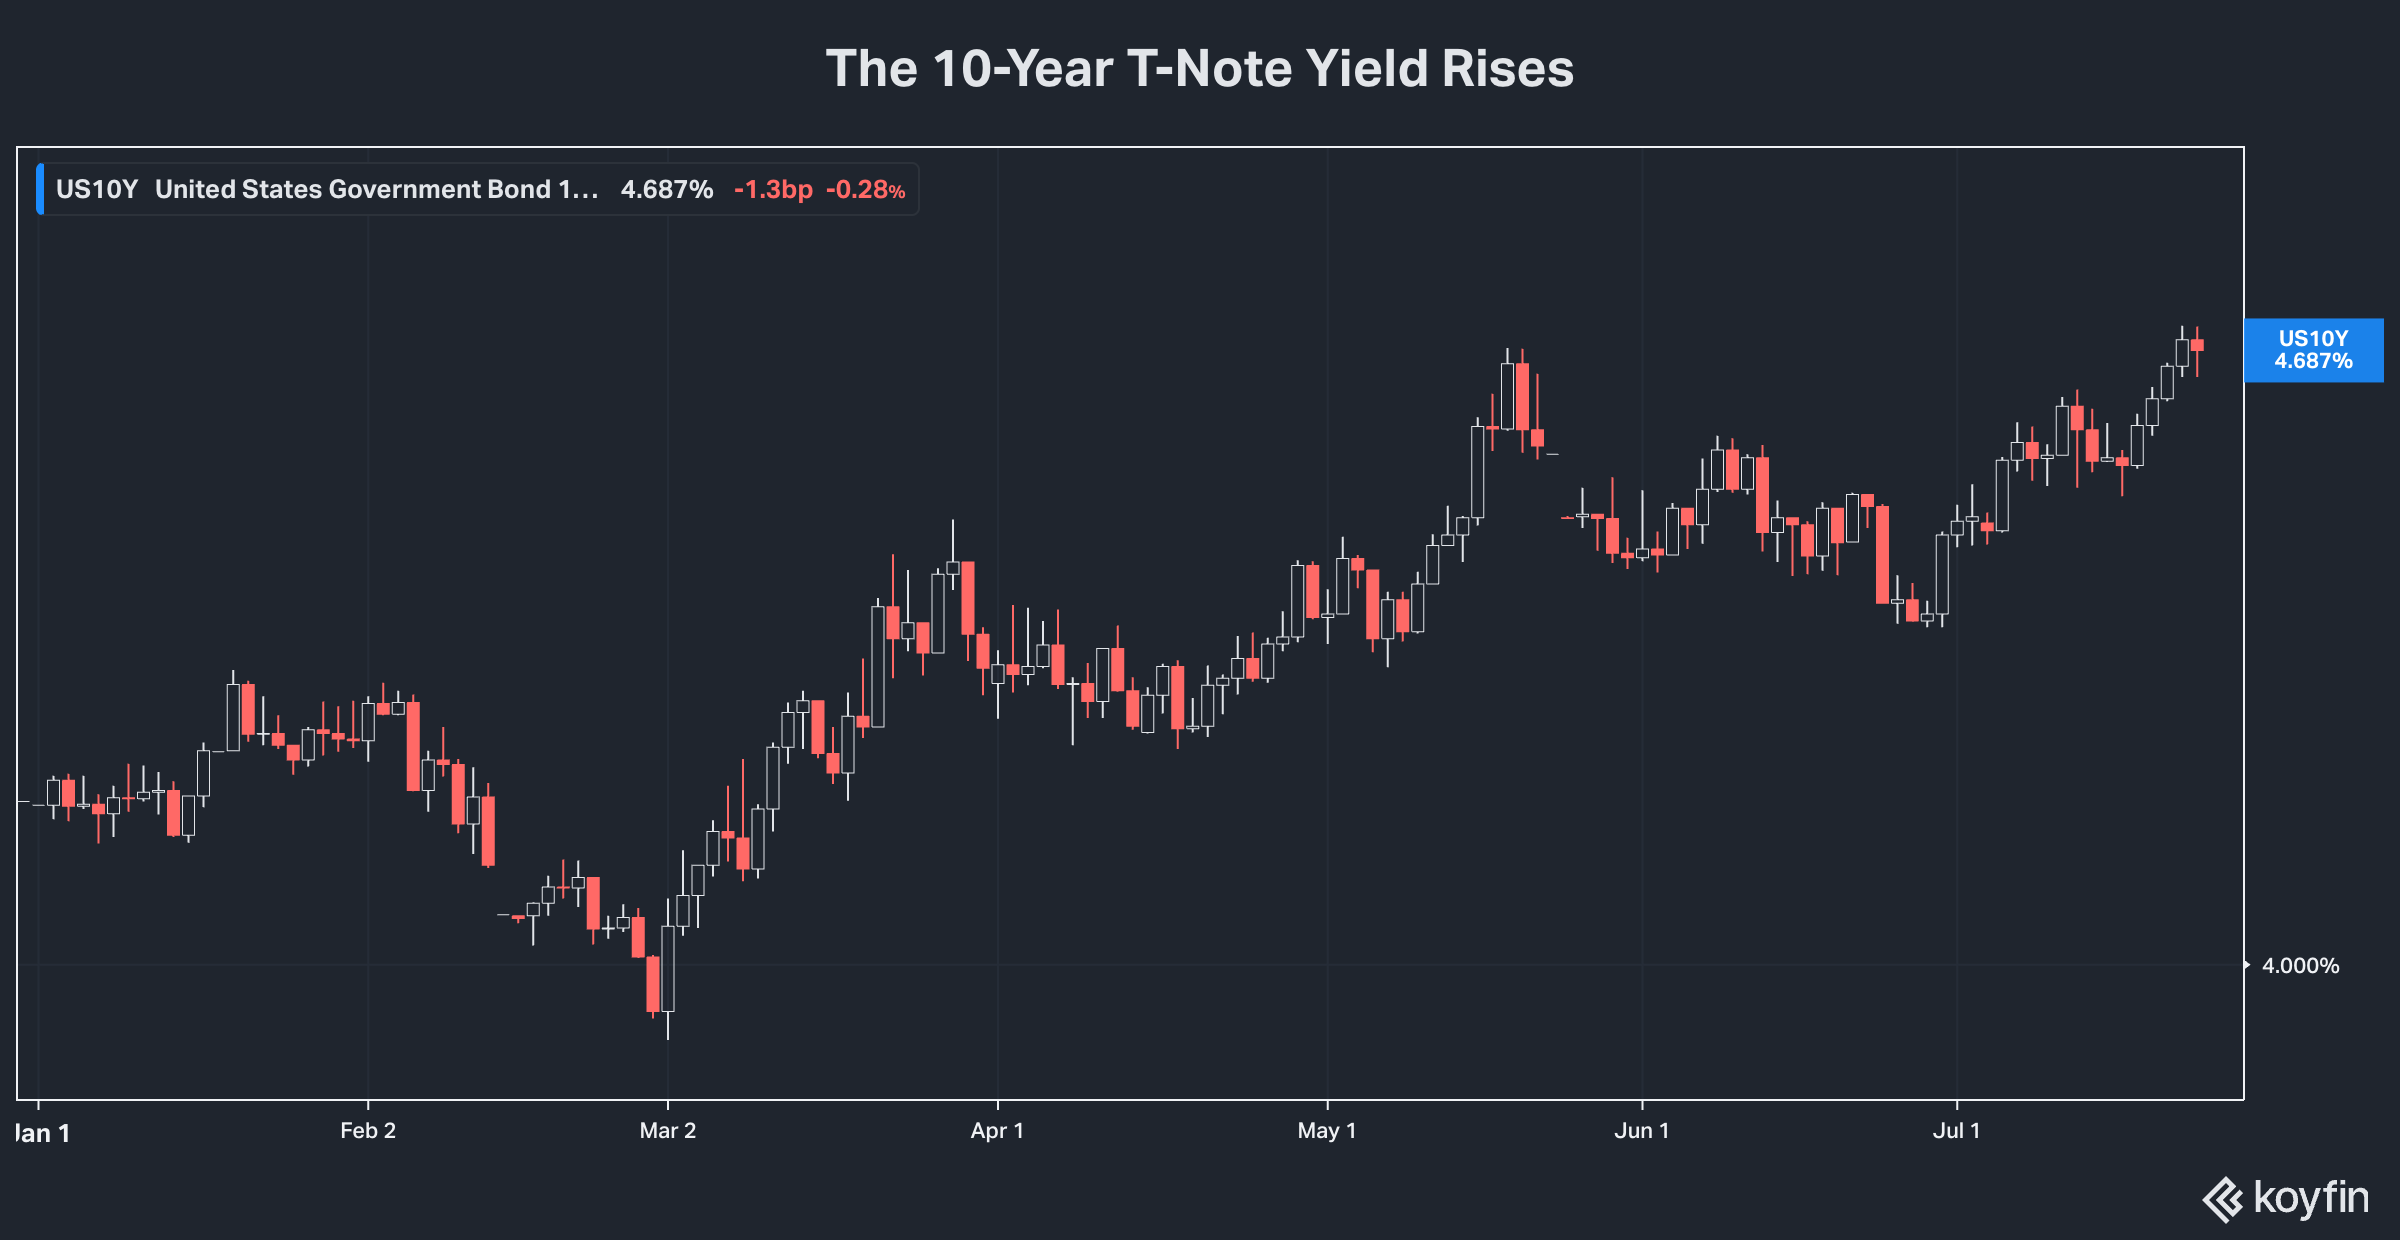
The narrative in the big investment media is that’s a reaction to increased odds of monetary tightening. But longer-term interest rates are not set by the Fed. Rather, they follow lenders and bond investors’ expectations for future inflation.
A real expectation of Fed tightening—raising short-term rates to slow economic growth and inflation—is usually very bullish for long-term bonds. In contrast, concerns the central bank’s hands are tied by weaker-than-apparent labor market conditions lead to more worries about inflation and higher long-term interest rates.
After backing off sharply from February through late June, gold prices have been running in place over the past month or so. But they’ve also held steadily over $4,000 an ounce, a level about 60% above where they started 2025 and twice where the metal was at the beginning of 2024.
How to Buy Gold
If expectations for “transitory” inflation prove overly optimistic, gold will make another run over $5,000 by the end of the year. That will hand investors in physical gold a hefty profit from current levels. And that includes bullion, coins, numismatics and jewelry.
Investors can own the equivalent of bullion by buying the Gold Trust ETF (GLD) or Gold.com Inc (GOLD) without having any physical holdings. But I prefer mining stocks for two main reasons.
First, gold companies’ earnings are leveraged to gold prices. And given in the action we’ve seen over the past year, we’re at that stage of the cycle when gold mining stocks are leveraged to prices as well.
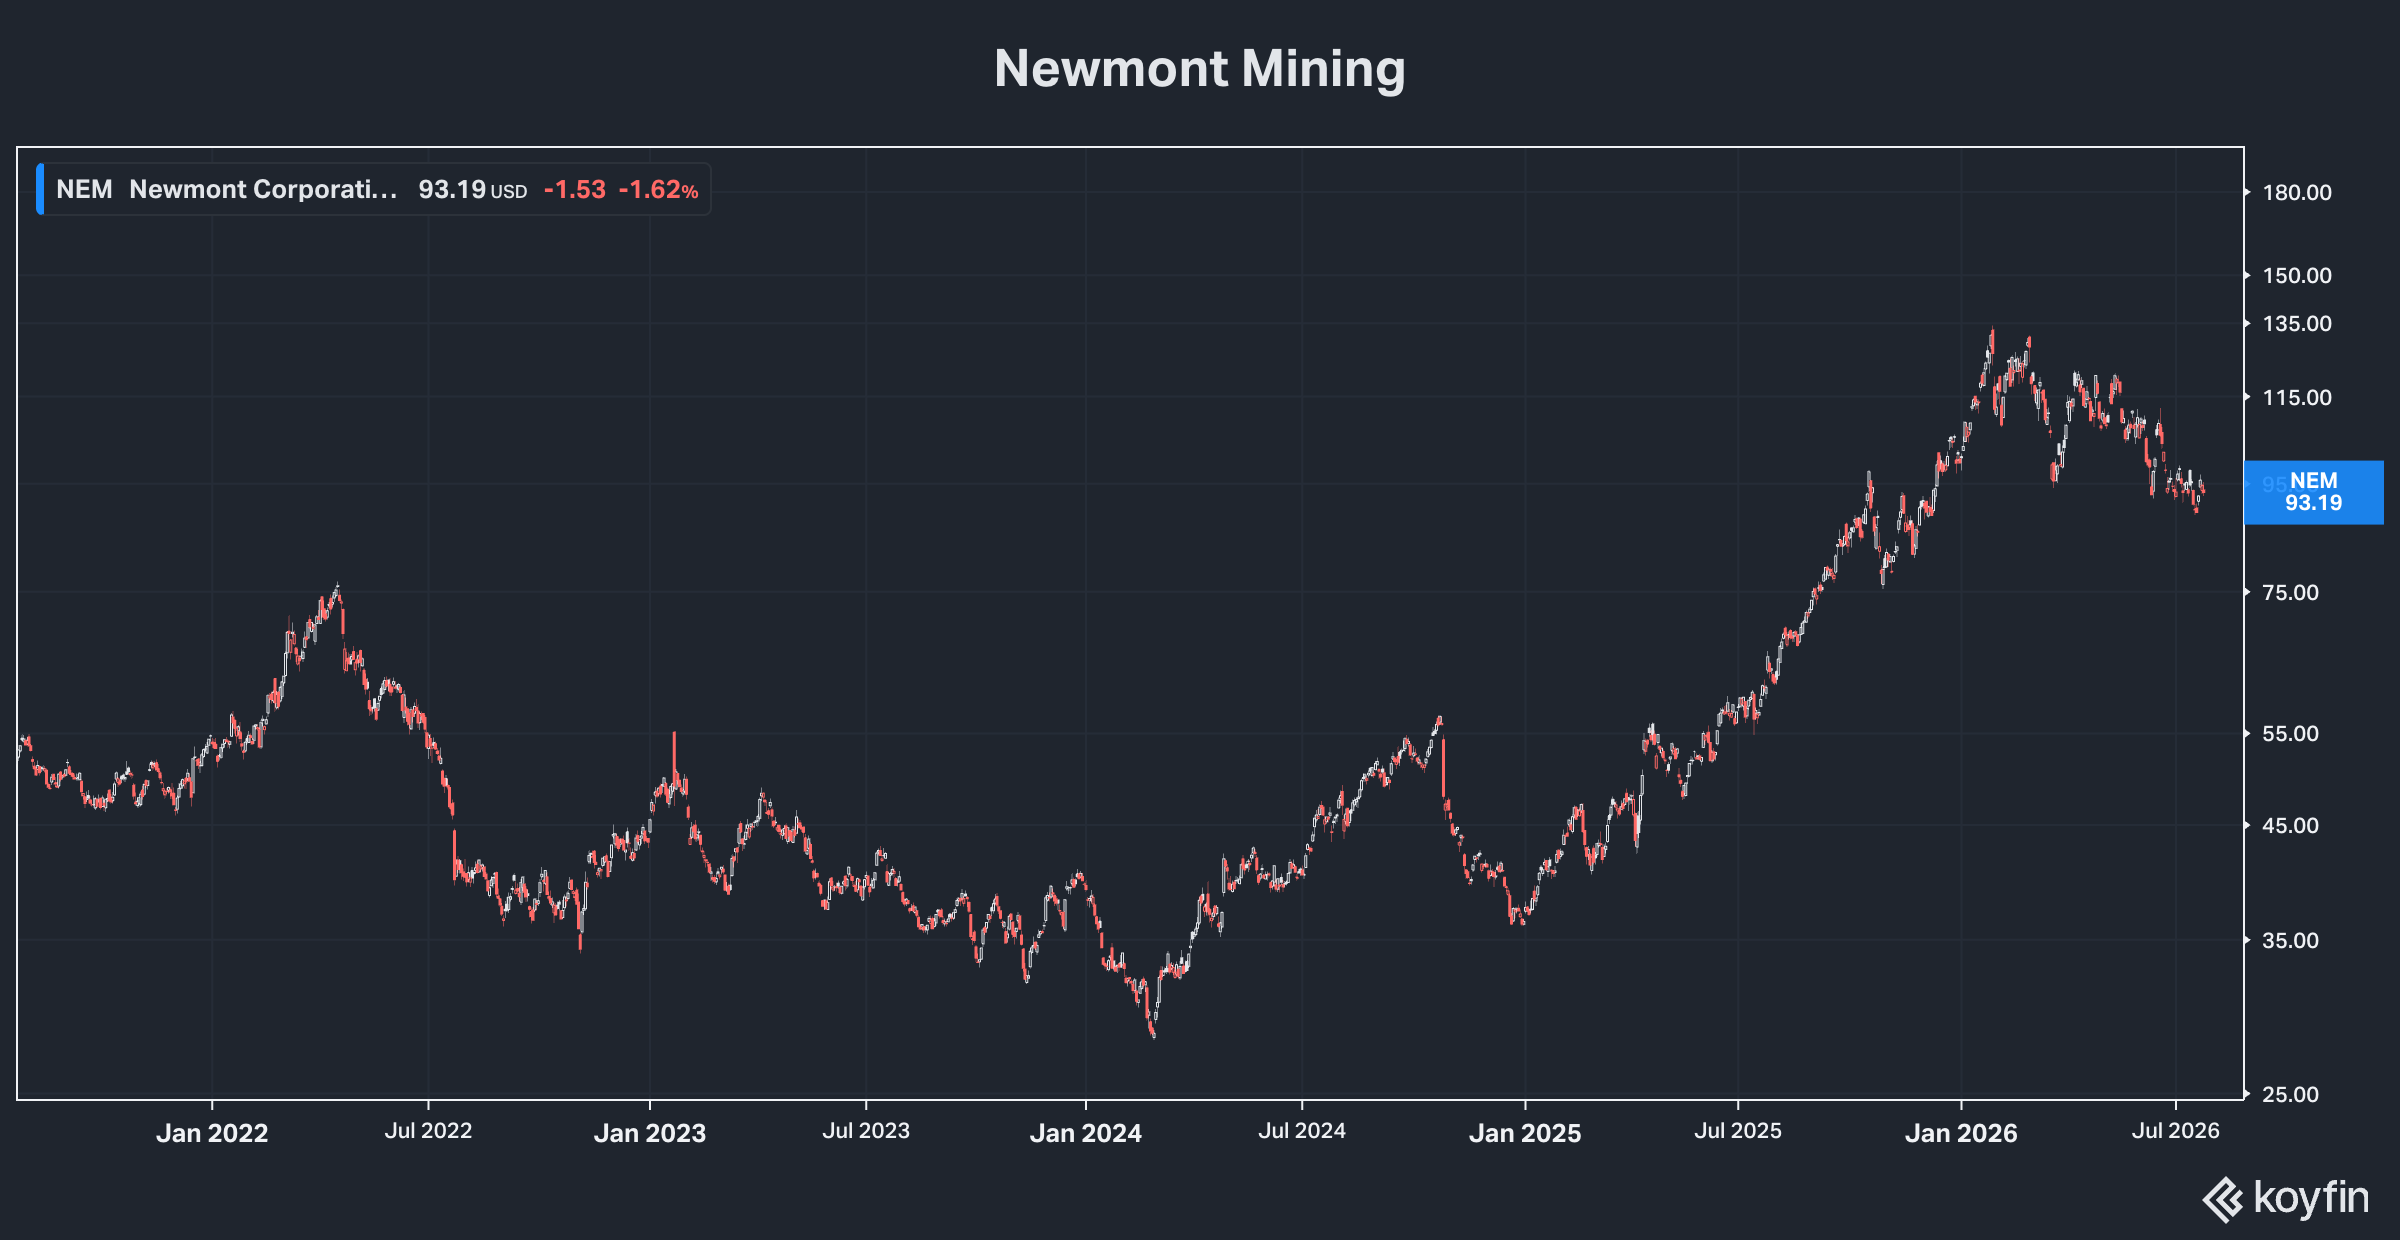
Newmont Corp (NYSE: NEM), for example, reported an all-in average realized selling price of $4,414 per gold ounce equivalent in Q2 2026. The company’s “all-in sustaining costs” (AISC) were $1,621 per ounce, for an effective margin of $2,793 per ounce. In contrast, in Q1 2025, the company sold its gold for $2,944 an ounce with AISC of $1,447, for a margin of $1,346.
A roughly 50% boost in Newmont’s average realized selling price for gold boosted its margin by roughly 108%! That gain also includes productivity gains realized by the company from its transforming merger with the former Newcrest. And the leverage cuts both ways—a drop in gold prices will show up in a larger percentage drop in company earnings. But since early 2025, Newmont is up about 160% versus about 60% for physical gold.
Second, major gold producers like Barrick Mining Company (NYSE: B) and Newmont Corp pay cash dividends. And those payouts will rise with the metal’s price as well.
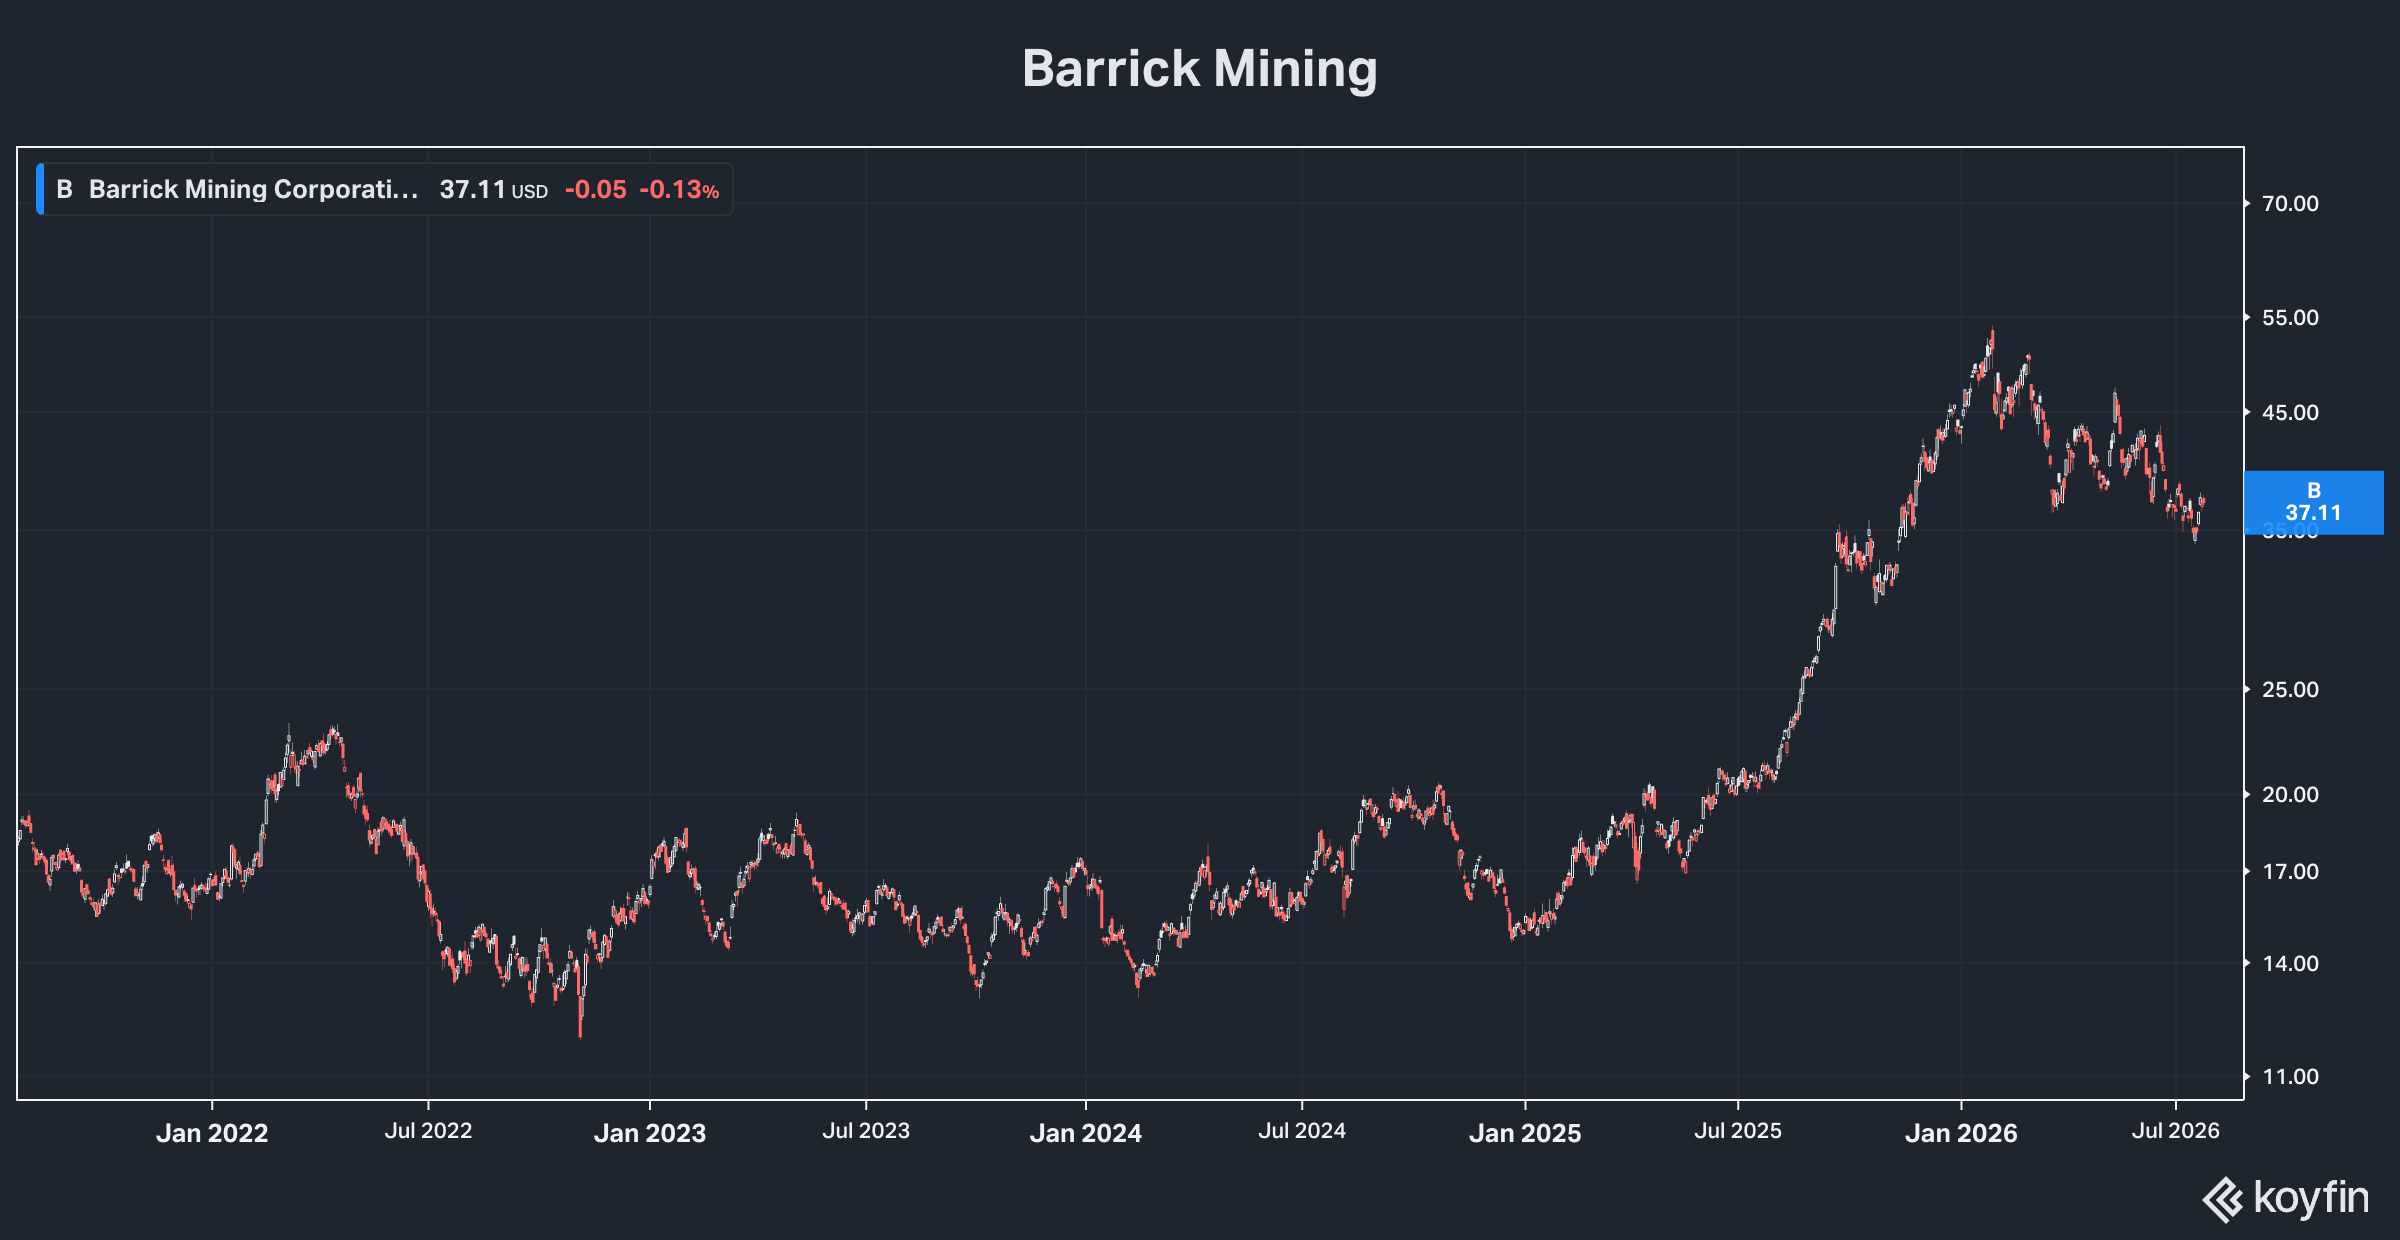
Barrick, for example, responded to gold’s 2024-25 surge by launching a new dividend policy in February. They’re now targeting 50% of annualized free cash flow for cash dividends and stock buybacks. That includes a “base” dividend of 17.5 cents per quarter.
Barrick paid that plus a variable portion of 24.5 cents for a total cash dividend of 42 cents per share in March. The June payment was just the base with no variable rate payout. But another surge in gold prices will see another boost.
Admittedly, capital gains will be more important to gold stock returns, even for dividend paying companies like Barrick. But a high cash payout is a solid underpinning for stocks that are likely to perform best when dividend stocks in other sectors are under pressure.
What percentage of gold stocks and related investments is ideal for income-oriented portfolios? I don’t really have a firm number. But mining companies are overall about 10% of this portfolio, while resources related stocks in total are around 20%.
Year-to-date, my resource stocks are up close to 30%. That’s a little less than the Energy SPDR ETF (XLE) at about 35%. It’s considerably better than the MSCI World/Metals & Mining (GDX), which is underwater -12.3%.
Performance is in the context of a relatively good year for oil and copper and a weaker one for natural gas and gold prices. But these stocks are doing their job boosting returns in a year where inflation has remained a lot stickier and interest rates higher for a lot longer than the consensus expected.
If we do get that next leg up for resources, these stocks will add to their gains. At that point, I’ll be considering taking some money off the table. But come what may, they’re substantial companies that are more than capable of weathering a downturn in prices of the key commodities they produce.
That’s a major difference with the smaller companies in their respective industries. And it’s why I’m more than comfortable holding all of them in this portfolio.
Action Plan
The ideal is a balanced portfolio of high-quality dividend stocks drawn from a range of industries. I follow four basic strategy rules:
· Build and hold onto positions in companies with underlying businesses set for long-term growth that have healthy balance sheets. I sell when the business numbers tell me a company no longer offers that, even if it means taking a big loss.
· Maintain a cash reserve against the possibility of a broad correction. My favorite parking place for cash is still the Vanguard Federal Money Market (VMFXX), which currently has a 7-day SEC yield of 3.59%. It’s not the only suitable money market investment. But anything you choose should be sponsored by an organization that can protect $1 net asset value. And you should be able to access funds in a timely manner.
· Never overload on any one stock. That’s no matter how attractive a particular company looks. Spreading your bets is the surest way to limit risk you’ll be taken down by an unexpected setback with a single company. Diversification rather than doubling down also takes the emotion out of decision making.
· Make fresh investments in increments of two to three, rather than all in one purchase. And I will pare back positions when a stock rises far enough to be out of balance with the rest of the portfolio.
Earnings and guidance the next few weeks will give us a great read on the companies we own. These portfolio companies have provided them already:
